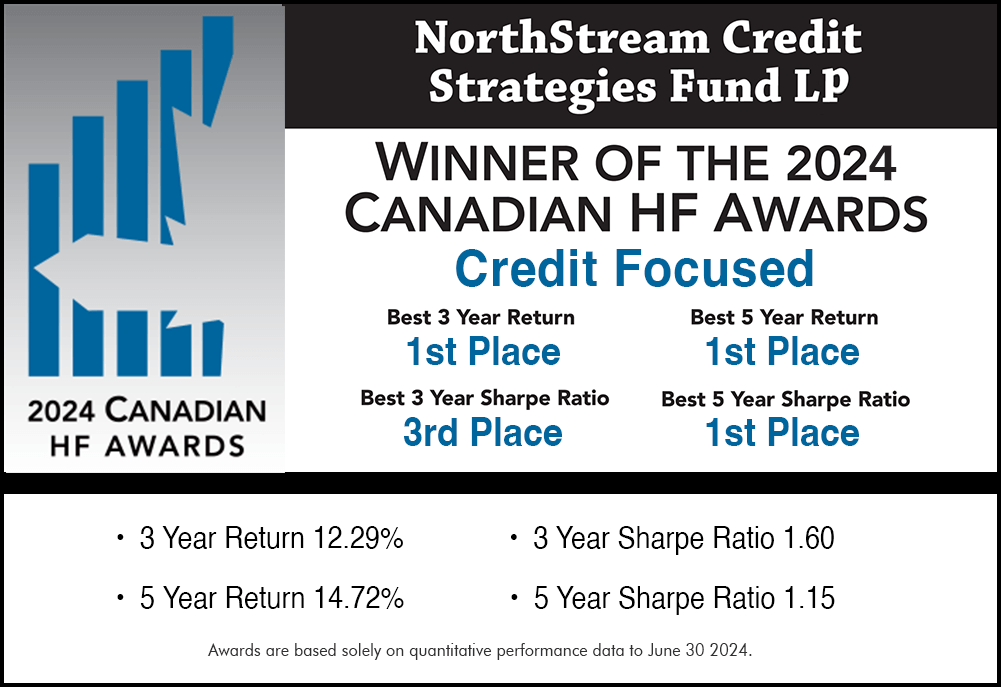
The NorthStream Credit Strategies Fund LP (“the Fund”) launched on May 2nd, 2016. The monthly returns below are shown net of all fees and expenses and are based on the Fund’s Class X Lead Series NAV. Monthly NAV and returns are calculated by SGGG Fund Services Inc.
| NorthStream Credit Strategies Fund LP | |||||||||||||
| Year | Jan | Feb | Mar | Apr | May | Jun | Jul | Aug | Sep | Oct | Nov | Dec | YTD |
| 2025 | 0.13% | 0.31% | -0.01% | – | – | – | – | – | – | – | – | – | 0.43% |
| 2024 | 0.55% | 0.14% | 0.21% | 0.51% | 0.38% | -0.36% | 0.07% | 0.63% | 0.64% | 0.49% | 0.61% | 0.53% | 4.48% |
| 2023 | 0.69% | 2.65% | 0.50% | 0.49% | 0.75% | 1.10% | 0.46% | 0.81% | 0.68% | 0.43% | 0.03% | -0.02% | 8.89% |
| 2022 | 1.35% | 0.24% | 5.67% | 3.81% | 3.74% | 2.09% | -0.95% | -1.33% | -0.62% | 1.39% | 3.25% | 3.09% | 23.70% |
| 2021 | 10.84% | 4.70% | 4.87% | -0.06% | 1.23% | 4.20% | -0.20% | -0.55% | 3.78% | 1.09% | -0.56% | 0.08% | 32.94% |
| 2020 | 0.32% | -0.43% | -14.44% | 0.43% | 1.03% | 3.67% | 1.01% | 2.99% | 1.88% | 2.36% | 2.18% | 9.47% | 9.09% |
| 2019 | 1.08% | 1.34% | 0.41% | 0.79% | -1.41% | 1.00% | 0.99% | -0.31% | 0.86% | -1.99% | 0.01% | 0.75% | 3.53% |
| 2018 | 1.32% | 0.01% | 0.72% | 0.72% | 0.52% | -0.17% | 0.30% | 0.30% | -0.11% | -0.61% | -1.44% | -0.67% | 0.85% |
| 2017 | 2.69% | 0.66% | -0.89% | 0.64% | 0.63% | 0.02% | 0.31% | 1.30% | 1.03% | 1.40% | 0.66% | 1.58% | 10.46% |
| 2016 | – | – | – | – | 0.49% | 0.81% | 3.4% | 2.98% | 2.29% | 2.12% | 0.75% | 2.88% | 16.80% |
| Return Since Inception: 176.12% | |||||||||||||
Past performance is not indicative of future results. Potential qualified investors should carefully read the Fund’s confidential offering memorandum prior to investing.
Note that the use of the XGB, TSX, and S&P 500 in the performance tables on this page is for informational purposes only. The XGB (iShares Canadian Government Bond Index ETF), TSX, and S&P 500 have a different composition than the Fund and are not comparable benchmarks. The XGB, TSX, and S&P 500 were chosen to compare the Fund’s performance returns against other asset classes.
| Performance & Risk Metrics | |
| Return Since Inception | 176.12% |
| YTD | 0.43% |
| 1-YR Return | 4.00% |
| Annualized Since Inception | 12.06% |
| % of Positive Months | 80.37% |
| Maximum Drawdown | -14.81% |
| Annualized Standard Deviation | 8.34% |
| Sharpe Ratio1 | 1.18 |
| Correlation | |||
| Index | XGB2 | TSX | S&P500 |
| Correlation | -19.29% | 34.80% | 21.65% |
| Upside Capture | 58.17% | 41.63% | 28.57% |
| Downside Capture3 | -103.92% | -16.59% | -17.85% |

1 Using 1-year T-Bills.
2 iShares Canadian Government Bond Index ETF (XGB).
3 Negative downside capture vs. XGB, TSX and S&P 500 is a result of NorthStream generating positive returns when these indices generated negative returns.

